RTDs vs Thermocouples

Working Principles and When to Use Each

This article will focus on the qualities of RTDs vs Thermocouples and their typical applications and principles.

Measuring temperatures in industrial engineering is a key part of monitoring the operation of the various mechanical, electrical, and electronic systems, determining their performance, and evaluating their health.

Likewise, in chemical processes, temperature and heat control may be crucial in achieving the desired end product. Additionally, the same applies to welding, heat treatment processes, industrial ovens used for plastic shrinking, and a wide range of other possible applications. That said, measuring temperatures is neuralgic in a wide range of engineering operations, and doing so with accuracy and precision is equally important.

While there are many types of thermometers that can be used for measuring temperatures including the familiar “mercury” thermometers, the bimetallic, and the vapor pressure thermometers, those that are most commonly and widely used in the industrial environment are the resistance temperature detectors (RTD) and the thermocouple devices. Both of these thermometer types have their respective advantages and drawbacks, and they are both suitable and valuable for a distinctively different set of applications.

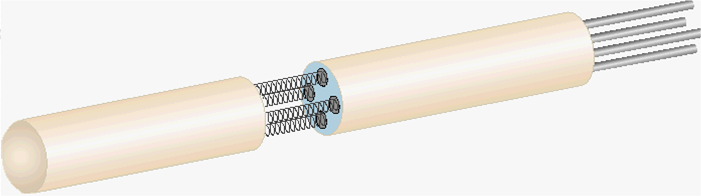
Working Principle of Resistance Thermometers (RTD)

The RTD temperature sensor is based on the temperature dependence of the electric resistance of metals. As the temperature increases for metal, so does its electrical resistance. Of course, there’s an intrinsic coefficient of resistance for all materials, and a positive value for this coefficient makes specific materials better than others for the measurement element role. With nickel and platinum, for example, there is near-perfect linearity that is introduced by their respective coefficients, resulting in high accuracy and precision across repeated measurements. Moreover, nickel and platinum are generally chemically stable and extremely resistant to corrosion.

Drawing of a Coil in Tube RTD.  Read the article for a breakdown of RTDs vs Thermocouples.
Coil-element Platinum Coil In Tube RTD. Source: Burns Engineering. Licensed Under CC-BY-SA-3.0
Continue reading “RTDs vs Thermocouples”

Digitalization and Digitization: What’s the Difference?

Close up of digitization/binary code.
Digitization/binary code

If you read industry publications, you’ve probably already come across the terms digitalization and digitization a couple of times today. But do you know the difference?

It’s easy to confuse the terms. But understanding how they differ will help you gain the most information and understanding of the digital mindset.

What is Digitalization?

According to IGI Global, Digitalization is the “adoption of digital technologies to modify a business model….by exploiting digital network dynamics and the giant digital flow of information.” On the other hand, digitalization leads to the creation of a digital business. According to Gartner, this is “the creation of new business designs by blurring the digital and physical worlds.” More about this in a minute.

What’s the Difference between Digitization and Digitalization?

Digitization is where digitalization begins, in the conversion of analog data into a digital form that can be processed by a computer. Digitalization transforms digitized data through the use of digital technologies like automation, computing, coding, AI, or IoT(to name a few) to change how work gets done. And while digitization can optimize and change the process to create a better workflow, reduce costs, or minimize waste, digitalization creates a core change that affects the entire business model.

Continue reading “Digitalization and Digitization: What’s the Difference?”

Nearly 10K Manufacturing Jobs Added in March in 12 States

Despite a shrinking job market due to the COVID-19 pandemic, the manufacturing sector showed job growth in twelve states.

A person cutting metal.  Manufacturing jobs like this can pay well.
Despite the COVID-19 pandemic, US manufacturing jobs showed growth in twelve states.

Over 700,000 workers lost their jobs in March across all sectors of the economy; 34,000 of those were manufacturing jobs. While news of large manufacturing layoffs and furloughs like ones at GE and Boeing have sparked alarm about the strength of the industry as a whole, the U.S. Bureau of Labor Statistics shows manufacturing posting significantly less than 1% job loss across all states. Twelve states, including Alabama, Arizona, Connecticut, Florida, Idaho, Kansas, Louisana, New Jersey, North Dakota, Rhode Island, South Dakota, and Utah all posted gains in employment that totaled 9200 jobs during the month of March. Additionally, four states reported no job losses.

Data below is broken down by state and compared to February 2020 employment numbers. All data was sourced from the US Department of Labor Bureau of Labor Statistics.

Updated March employment numbers can be found in our next post regarding April unemployment. These numbers were updated and released by the BOL on May 22, 2020.

Manufacturing Jobs Data by State

StateFeb 2020March 2020change% change
Alabama270,4002725002,1000.78%
Alaska11,20010900-300-2.68%
Arizona176,9001773004000.23%
Arkansas159,600158100-1,500-0.94%
California1,306,6001,304,500-2,100-0.16%


Colorado150,500149,000-1,500-1.00%
Connecticut161,300162,1008000.50%
Delaware26,80026,600-200-0.75%
District of Columbia1,4001,300-100-7.14%
Florida388,100389,1001,0000.26%


Georgia402,000401,100-900-0.22%
Hawaii13,90013,90000.00%
Idaho67,50067,7002000.30%
Illinois573,300573,200-100-0.02%
Indiana532,900530,100-2,800-0.53%


Iowa222,300221,800-500-0.22%
Kansas167,500168,2007000.42%
Kentucky252,200251,700-500-0.20%
Louisiana133,900135,3001,4001.05%
Maine52,30052,100-200-0.38%


Maryland113,700112,500-1,200-1.06%
Massachusetts243,000242,800-200-0.08%
Michigan621,600619,200-2,400-0.39%
Minnesota318,100317,400-700-0.22%
Mississippi148,600147,700-900-0.61%


Missouri276,300274,600-1,700-0.62%
Montana20,20020,000-200-0.99%
Nebraska99,00098,900-100-0.10%
Nevada59,00058,400-600-1.02%
New Hampshire71,20070,800-400-0.56%


New Jersey251,800252,7009000.36%
New Mexico28,80028,80000.00%
New York436,600435,800-800-0.18%
North Carolina476,700473,000-3,700-0.78%
North Dakota25,60025,7001000.39%


Ohio700,900698,300-2,600-0.37%
Oklahoma137,600137,400-200-0.15%
Oregon193,200192,300-900-0.47%
Pennsylvania573,700571,000-2,700-0.47%
Rhode Island39,20039,5003000.77%


South Carolina258,400258,40000.00%
South Dakota43,40043,8004000.92%
Tennessee354,100353,900-200-0.06%
Texas910,500900,700-9,800-1.08%
Utah135,400136,3009000.66%


Vermont29,30029,000-300-1.02%
Virginia241,400240,100-1,300-0.54%
Washington290,900290,000-900-0.31%
West Virginia46,20045,800-400-0.87%
Wisconsin477,600477,400-200-0.04%


Wyoming10,00010,00000.00%
Puerto Rico75,30075,000-300-0.40%
Virgin Islands80080000.00%


Totals:
12,778,70012744500
-0.27%
A chart showing manufacturing job numbers by state.